The masses have been confounded by the strength of this current secular bull market. Too many keep betting against it and they’ve cost themselves a huge opportunity for profit as prices have soared. I’ve pointed out on many occasions that the biggest stock market gains have historically occurred in the one and two years following the bottom of a bear market and that’s certainly playing out again. In the previous 10 cyclical bear markets since 1950, the S&P 500 has averaged gaining 57.12%, with the largest gain being the two years following the 2020 pandemic low (+103.31%) and the smallest gain coming two years after the Persian Gulf war low (+36.49%).
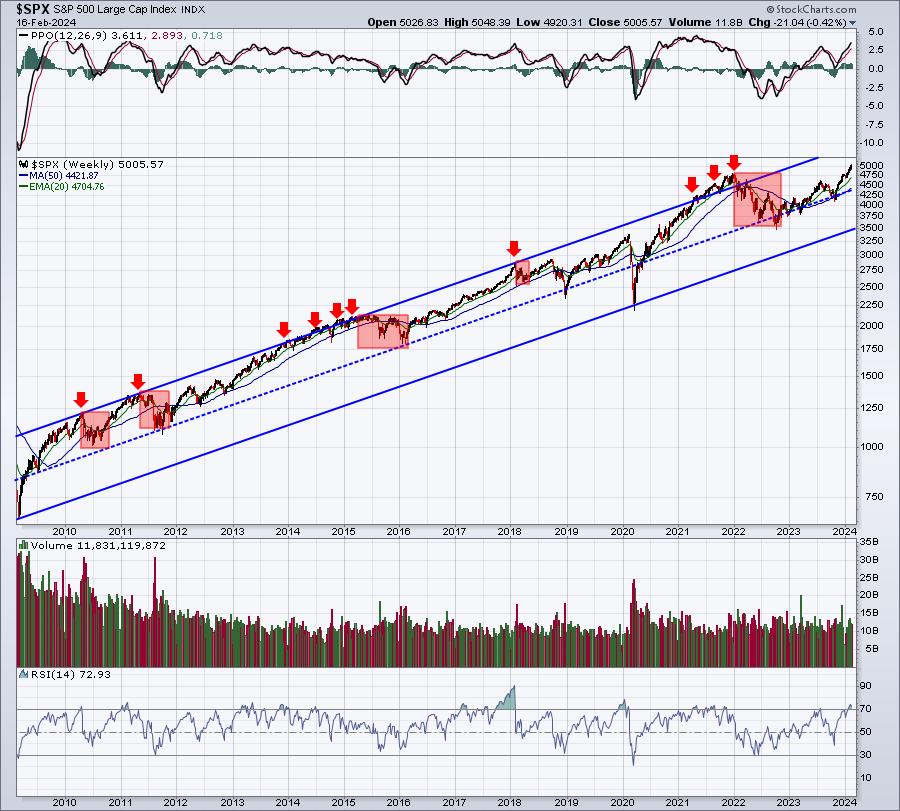
Where are we now? Well, we’re less than 1 1/2 years from the October 2022 low and the S&P 500 is up 45% since that time. The NASDAQ 100 ($NDX) has gained nearly 70% over that same period. Gains from here will likely prove to be much more difficult and history bears this out. The gains we’ve had since the 2022 cyclical bear market bottom are unsustainable over the long-term. We still have plenty of room to the upside in our secular bull market channel, as you can see below:
The one signal that most analysts, technicians, and traders are overlooking is the most important one of all. The combination of price and volume trumps all other indicators, PERIOD. Yet nearly everyone wants to put their faith in secondary indicators and (gasp!) fundamental news. Just take 15 seconds and look at how secular bull markets develop. This channel does not lie. Everything here is factual. When we’re at or even just above the upper channel line, then we can have a discussion. At any other point, expect higher prices. This is very simple, basic perspective that no one wants to talk about. It’s sexier to talk about inflation, breadth, interest rates, go away in May (get ready bears, we’re only a couple months away from this one!), and the latest Hindenburg Omen signal, another breadth indicator that’s been wrong 75% of the time. But, hey, if we can scare the heck out of traders one more time and use it as awesome CLICK BAIT, then let’s do it.
Honestly, it’s no wonder why people are scared to death of the stock market. Around every corner is yet another expert indicating a HUGE problem that’s going to leave the stock market in ashes and all of us in total financial despair. What a great way to go through life! Now look at that chart above for 15 seconds again. Ok now turn off CNBC and keep looking at this chart. Your investing life just got a lot easier. You’re welcome.
Manipulation is BAAAACK!!!
One major reason why I turned bullish in June 2022 near the bottom of the bear market was the manipulation that I could see playing out. The QQQ (ETF that tracks the NASDAQ 100) saw tremendous distribution through the April/May period in 2022. There was selling at the opening bell in the form of gap downs, morning selling, and afternoon selling right into the close. It was crystal clear that a bear market gripped Wall Street. But it all started to change in June 2022, when rotation from value to growth started favoring an end to the slaughter. Also, very clearly, distribution began to flip to accumulation. Net gaps and morning weakness continued to dominate, but there was TREMENDOUS buying from 11am ET to the closing bell. We were still going lower, but it was because of opening gaps to the downside and panicked selling in the first 30-60 minutes. AD (accumulation/distribution) lines were moving higher to confirm what I was seeing in terms of afternoon accumulation.
Recently, I’m seeing similar manipulation with the small cap IWM (ETF that tracks the Russell 2000). Check out this chart:
The last 6 weeks have been eye-opening for small caps. They appear as though they’ve gone nowhere and they’ve certainly been an underperformer relative to the S&P 500. But the current continuation pattern, a possible cup with handle, is extremely bullish after an uptrend. I wouldn’t be surprised to see a bit of short-term weakness to form a handle, before a much larger move to the upside in small caps. And if we look under the hood of the IWM, it’s easy to see accumulation taking place as buyers are plentiful in the afternoons. One interesting stat is that the IWM has gained ground 14 of the last 15 days between the hours of 11am and 2pm. The intraday buying is real.
Looking Ahead
I am beginning to focus more and more on small- and mid-cap stocks and believe they’ll be leaders during the balance of 2024. Their role in our portfolios is likely to increase. We just completed our latest quarter’s portfolio performance with our flagship Model Portfolio gaining 21.27%, more than doubling the S&P 500’s return of 10.07%. That’s consistent with our long-term performance, where we’ve seen our Model Portfolio gain 182.59% since November 2018, while the S&P 500 has risen 86.03% – again, more than a doubling of the benchmark.
On Tuesday, February 20th, at 5:30pm ET, I’ll be hosting our Top 10 Stock Picks webinar, where I’ll unveil the 10 equal-weighted stocks to represent our Model Portfolio for the next 3 months, along with the 10 stocks in our other 2 portfolios, Aggressive and Income. I like to think of this event as our DRAFT, with EarningsBeats.com holding all Top 10 draft picks! There are a number of factors that go into stock selection, but a very important one is relative strength. We want leading stocks and look to their leadership roles to carry our portfolios past the benchmark S&P 500. CLICK HERE for more information and to register for this FREE event!
Happy trading!
Tom


More Stories
This Beaten-Down Magnificent Seven Stock is Poised to Regain Its Leadership Status
Three Leading Growth Stocks Testing Gap Support
Risk-On Trades Emerge Amid Big Tech Selloff