Twice in the past few weeks President Joe Biden has claimed that when he took office in January 2021 inflation was “over nine percent.” First on CNN’s OutFront with Erin Burnett on May 8 and again on May 14 in a Yahoo! Finance interview, the bizarre comment was made. And as has become a routine with the gaffe-prone chief executive, White House staffers added shamelessness to what could have been limited to embarrassment by issuing a statement: “The President was making the point that the factors that caused inflation were in place when he took office. The pandemic caused inflation around the world by disrupting our economy and breaking our supply chains.”
Americans will have to decide for themselves if the claim made by Biden was a lie intended to mislead anyone not familiar with the trajectory of prices over the past several years, or an innocent error. It is a choice US citizens have been confronted with frequently, in particular where assertions regarding the health of the economy have been made.
If an honest mistake, it simply may be that the President confused the January 2021 inflation number with a number of other price statistics beginning with the number nine in the month of his inauguration. Below are several possibilities.
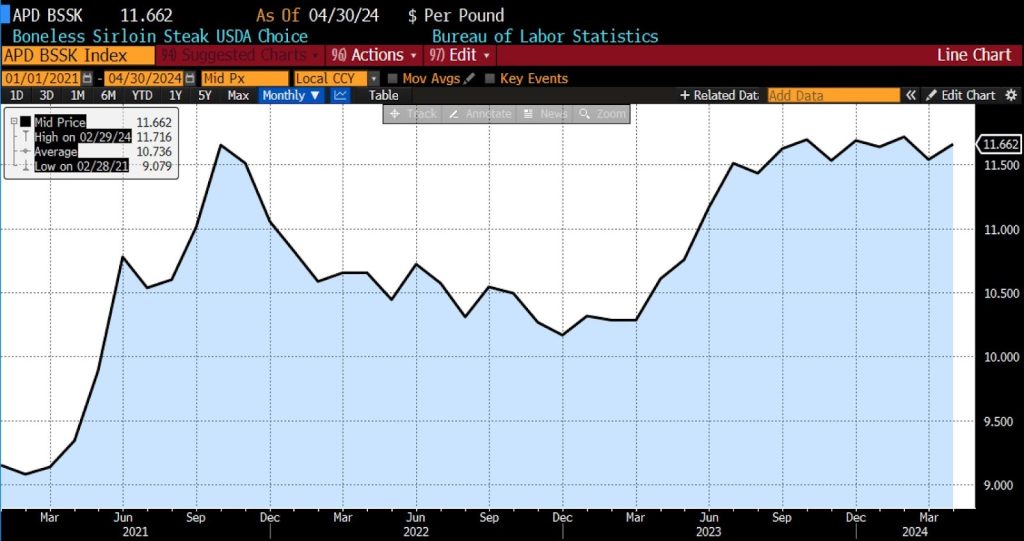
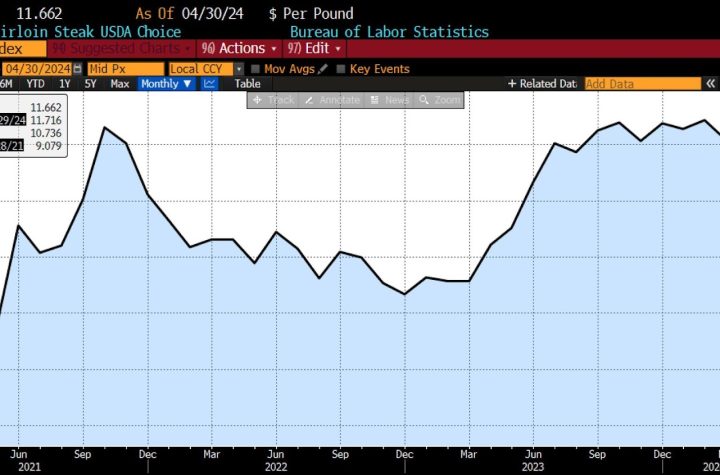
In January 2021, the Bureau of Labor Statistics reported in their consumer prices summary that the average price of a boneless sirloin steak was $9.418. By April 2024 that price had risen 27.5 percent to $11.662.(Source: Bloomberg Finance, LP)
In January 2021, fifteen subindices of CPI began with the number nine. Their levels in that month, in the April 2024 report, and the percent change are shown below. CategoryJan 2021Apr 2024Pct chg1Women’s dresses90.881112.83124.20%2Tools, Hardware, Outdoor Equipment/Supplies92.441110.47619.50%3Nonprescription Drugs94.853111.82117.90%4Women’s Underwear, Nightwear, Sportswear96.923113.84217.50%5Hospital and Related Services936.8371091.31416.50%6Womens Apparel97.492113.45316.40%7Medical Equipment and Supplies95.402110.0115.30%8Women’s and Girls’ Apparel98.301112.52814.50%9Sewing Machines, Fabric and Supplies93.216106.65714.40%10Household Furnishings and Supplies92.871106.03714.20%11Elementary & High School Tuition & Fees901.661004.13411.40%12Women’s Outerwear90.64298.6598.80%13Telephone Services94.16594.6240.50%14Recreational Books99.67198.626-1.00%15Major Appliances94.12191.288-3.00% Sixty subindices of the Personal Consumption Expenditure Price Index began with the number nine in January 2021 as well. Their levels in that month, in the April 2024 report, and the percent change are shown below. CategoryJan 2021Apr 2024Pct chg1Mutual Fund Sales Charges93.182204.823119.80%2Auto Leasing96.733140.28745.00%3Truck Leasing96.706140.24745.00%4Motor Vehicle Leasing96.765138.74743.40%5Food Produced and Consumed on Farms99.567138.35139.00%6Public Transportation91.513120.93332.10%7Accommodation93.386119.06827.50%8Foreign Travel in the United States97.372123.97827.30%9Elementary and Secondary School Lunches91.57116.12426.80%10Passenger Fares for Foreign Travel91.751115.09125.40%11Financial Service Charges and Fees95.364118.71324.50%12Securities Commissions95.608118.08323.50%13Admissions to Specified Spectator Amusements97.666119.46622.30%14Market-based PCE Financial Services & Insurance96.438114.99219.20%15Photo Studios97.754115.27917.90%16Nonprescription Drugs97.365114.56817.70%17Window Coverings94.669110.13616.30%18Children’s and infants’ clothing96.357111.57215.80%19Other Medical Products95.8110.8715.70%20Therapeutic Medical Equipment95.801110.8715.70%21Clothing Materials99.749114.59514.90%22Sewing Items99.751114.59714.90%23Photo Processing92.004105.66714.90%24Furniture and Furnishings99.927114.06314.10%25Personal care products99.213112.85213.70%26Film and Photo Supplies92.224103.70612.50%27Luggage and Similar Personal Items96.722108.59212.30%28Internet Access99.197111.18612.10%29Mens and Boys Clothing97.341108.55711.50%30Therapeutic Appliances99.271110.50211.30%31Control Group99.722110.41210.70%32Taxicabs and ride sharing services98.409108.2510.00%33Intracity Mass Transit98.501108.35110.00%34Garments93.191102.50810.00%35Clothing and Footwear94.361103.7299.90%36Market-based PCE Clothing and Footwear94.353103.729.90%37Other Clothing & Footwear98.401107.8919.60%38Shoes and Other Footwear98.291107.6859.60%39Finished Goods less Food and Energy98.946108.3259.50%40Durable goods97.78106.3778.80%41Womens and Girls Clothing90.34398.0498.50%42Jewelry97.073105.2668.40%43Jewelry and watches99.087107.1038.10%44Recreational Items92.35399.6487.90%45Foreign Travel By US Residents98.902106.0147.20%46Cosmetics, Perfumes, Bath, and Nail Preparations and Implements96.251102.4856.50%47Sporting Equipment, Guns, and Ammunition99.706105.4445.80%48Clocks, Lamps, and Decorator Items92.06796.8855.20%49Other durable goods92.24295.3153.30%50Market-based PCE Durable Goods Other than Motor Vehicles & Parts94.16297.0493.10%51Nonelectric Cookware and Tableware91.40692.8651.60%52Educational Books99.29599.6010.30%53Other Direct Commissions96.53996.6530.10%54Medical Laboratories98.0298.0910.10%55Communication93.40492.69-0.80%56Market-based PCE Communication Services93.40492.69-0.80%57Household Linens94.12693.351-0.80%58Motorcycles99.74898.92-0.80%59Employment Agency Services98.68294.998-3.70%60Personal Computers and Peripheral Equipment90.07185.868-4.70%Alternatively, Mr. Biden may have mistaken a different January 2021 economic statistic with the July 2022 year-over-year headline CPI number.
The spread between the 1-year US Treasury bill and the 10-year US Treasury note was 97.9 basis points (0.98 percent) in mid-January 2021. That spread inverted in mid-2022, about the time that headline CPI year-over-year actually reached 9.1 percent. A normal yield curve slopes upward, with a positive spread showing that longer-term bonds yield more than shorter-term ones, typically reflecting expectations of economic growth and rising future interest rates. An inverted yield curve slopes downward with a negative spread as shorter-term bonds yield more than longer-term ones. Those conditions are often considered a predictor of an economic recession. As of May 2024, the 1-to-10 year spread has been negative for over 600 days.1-year Treasury bill 10-year Treasury note spread (Jan 2021 – present)
Industrial Production (2014 – present), with all-time high (red dotted line), and January 2021 (black vertical line) indicated
(Source: Bloomberg Finance, LP)
It’s possible that Mr. Biden has once again fumbled details accidentally. Yet the consistency of those blundered messages, each absolving his administration of responsibility for declining economic conditions, is simply not consistent with randomness. American citizens have been told that corporate profits, Vladimir Putin, owners of gas stations, and ocean shippers are responsible for the huge surge in prices. Month-to-month and year-to-year price change data has been conflated misleadingly, as have statistics regarding how the US inflationary surge compares to those in other nations.
Whatever the specific reasons, the desperate evasiveness is glaring. Knowing that the CPI was not “over 9 percent” in January 2021, but rather 1.4 percent, hitting 9.1 percent in July 2022, is one thing. Recognizing that the administration of monetary policy has become a third-rail issue to be evaded at all costs is another, more pressing, matter. Instead of properly attributing the increase in prices to expansionary monetary policies (and to a lesser extent, massive debt and deficits), many in the political establishment prefer to tell ham handed-lies which further erode an already ramshackle credibility. It may be that the political establishment believes that the American public is not sophisticated enough to understand the Fed. More likely, the ability of the Fed to provide a swift economic boost during crises (without the lengthy process that fiscal stimuli require) is deemed too important to endanger by drawing attention to: even the staunchly anti-high finance Elizabeth Warren voted against auditing the Fed in 2016. The bipartisan inclination to keep the US central bank out of critical discussions is one which, whether inflation subsides or the Fed heeds calls to normalize at the 3-percent level, demands closer scrutiny.


More Stories
Anthony Blinken Is Playing a Dangerous Game with Ukraine
‘Tyranny’ by Any Other Name
Texas Continues to Push Back Against ESG, But Is It Enough?