The previous week turned out quite volatile for the markets as they not only marked a fresh lifetime high but also faced corrective pressure as well towards the end of the week. The markets maintained an upward momentum all through the week. It scaled the psychologically important 25000 level as well but found itself succumbing to the corrective pressure in the end. The trading range got a bit narrower as the trend was absent in the first half of the week. The headline index oscillated in a 391-point range. The headline index closed with a net weekly loss of 117.15 points (-0.47%).
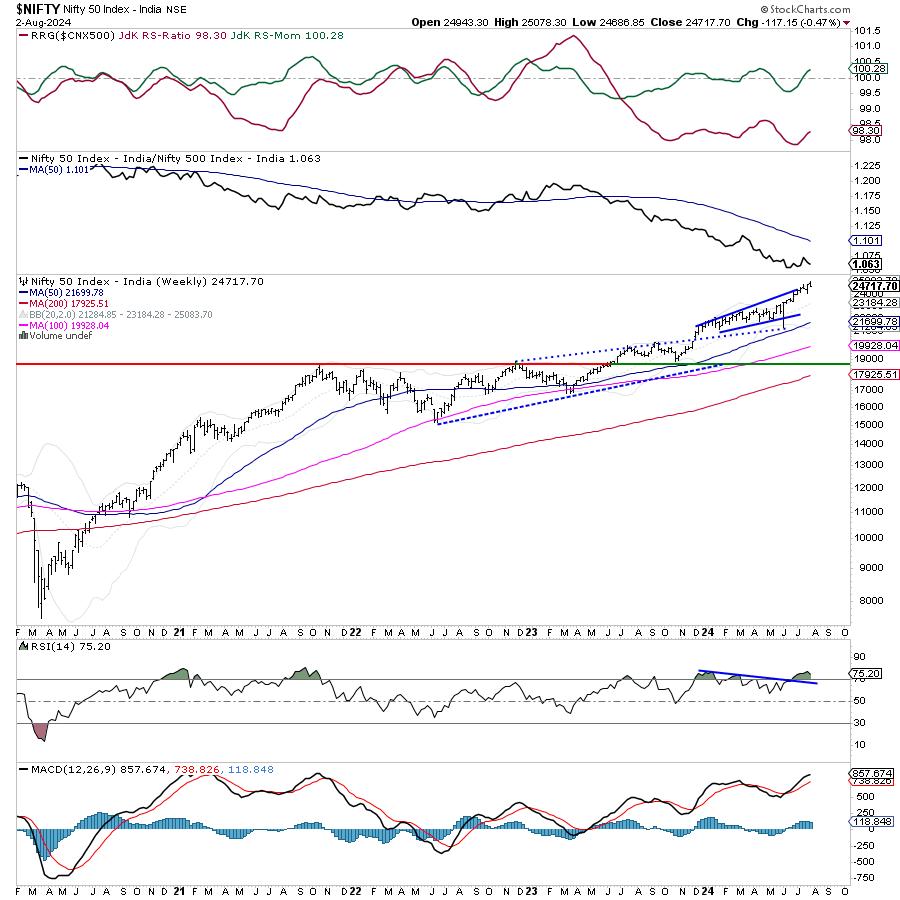
From a technical perspective, the markets continue to remain vulnerable to profit-taking bouts from higher levels. They also remain significantly deviated from the mean. The nearest 20-period MA is 1533 points and the 50-period MA is 3018 points from the current close. Any small reversion to the mean leaves enough room for a measured corrective move to take place. The volatility also spiked; the volatility gauge, INDIA VIX surged higher by 16.92% on a weekly basis.The markets may see a weaker and tepid start to the week on Monday. The levels of 25000 and 25150 are expected to act as immediate resistance levels. The supports come in at 24500 and 24280 levels. The trading range is expected to get wider than usual over the coming days.
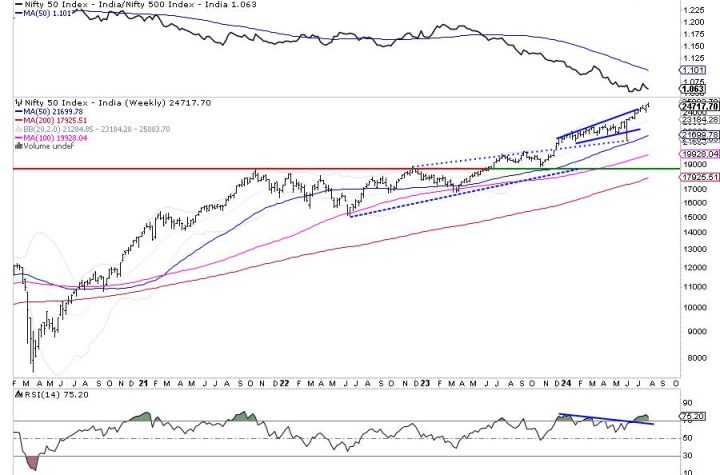
The weekly RSI is 75.20; it remains in overbought territory. It also stays neutral and does not show any divergence against the price. The weekly MACD is bullish and stays above the signal line.
The pattern analysis of the weekly chart shows that the Nifty has significantly deviated from its mean. This leaves room for measured retracement to take place even if the primary uptrend stays intact. In any case, the level of 25000 has become an intermediate top for the markets; no trending upside may take place unless this level gets taken out convincingly.
All in all, the markets are at a stage where we can expect some risk-off sentiment to prevail. The breadth has been weak and this may contribute to all upsides getting sold into as well. Although there are no signs of any major downturn, some amount of measured corrective moves or a broad-ranged consolidation cannot be ruled out. It would be important that given the present technical structure, one has to stick to those stocks that show promising technical setups as well as improving relative strength. Upsides should also be used to guard profits in stocks that have run up too hard. While resisting the urge to chase any technical rebounds, protecting profits is advised at higher levels. A cautious and stock-specific approach is advised for the coming week.
Sector Analysis for the coming week
In our look at Relative Rotation Graphs®, we compared various sectors against CNX500 (NIFTY 500 Index), which represents over 95% of the free float market cap of all the stocks listed.
Relative Rotation Graphs (RRG) show a continued lack of leadership among the sectors that would relatively outperform the markets. The Nifty MidCap 100 index is the only one inside the leading quadrant; that too is seen giving up on its relative momentum.
The Nifty Consumption, Auto, Realty, PSE, Metal, and Infrastructure Indices are inside the weakening quadrant.
The Commodities sector index has rolled inside the weakening quadrant. The PSU Bank Index is also seen languishing inside the weakening quadrant. The Pharma and the Energy Indices are inside the lagging quadrant as well but they are seen improving on their relative momentum.
The Financial Services, FMCG, IT, Media, Services Sector, and Nifty Bank indices are inside the improving quadrant. Stock-specific shows may be seen while these groups continue to better their relative performance against the broader markets.
Important Note: RRG™ charts show the relative strength and momentum of a group of stocks. In the above Chart, they show relative performance against NIFTY500 Index (Broader Markets) and should not be used directly as buy or sell signals.
Milan Vaishnav, CMT, MSTA
Consulting Technical Analyst
www.EquityResearch.asia | www.ChartWizard.ae

More Stories
Recession Fears Top of Mind As Tech Stocks Selloff
It’s been a long time Mr Bear, where have you been?
This Breadth Indicator Points to More Downside – And a Potential Opportunity